1 ABSTRACT
In the modern sporting world, not only professional, but also amateur and hobby athletes try to permanently improve their performance and results in competitions besides their main job.
In some sports the equipment choice plays a huge role in the overall performance. In cycling, particularly time trialling and triathlon competitions, the rider has to fight against the clock without outside assistance. Improving sports equipment has therefore become a big business and the number of manufacturers and their different products is almost uncountable.
As the power, needed to overcome aerodynamic drag, increases cubically with speed, good aerodynamics are essential
to competitiveness in these kind of races.
The wheels are only one part of the overall aerodynamics of the unit rider-bike (~10%), however an athlete can gain
significant time advantages with the optimum choice of wheels and tyres. With competitions often being decided by a
handful of seconds after several hours of racing, this can be the difference between winning and also-ran.
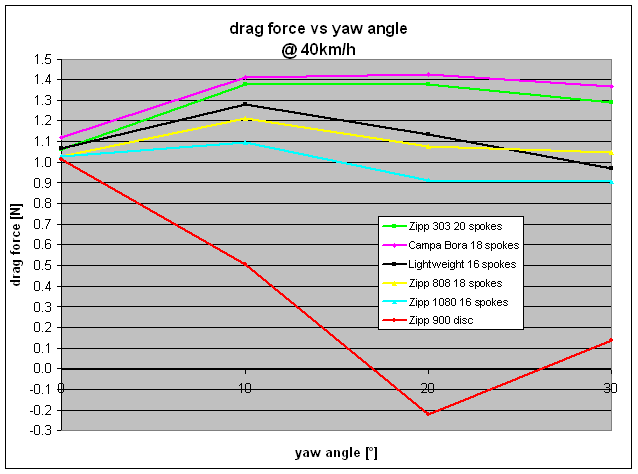
As wind tunnel testing is very expensive and almost unaffordable for small companies, these investigations should show, if a virtual wind tunnel in CFD can demonstrate the same effects as a real wind tunnel with comparable aerodynamic forces. By investigating six different wheels with varying rim profiles, depths and spoke counts, combined with upstream flow angles varying between 0° and 30°, this study should show if CFD is a valid tool to develop aerodynamic bicycle wheels.
[top]2 INTRODUCTION
Real world race conditions never offer perfectly still air or frontal wind (0°). Bicycle wheels have therefore to be developed for upstream flow angles, which are experienced in typical weather conditions by a typical racing cyclist.
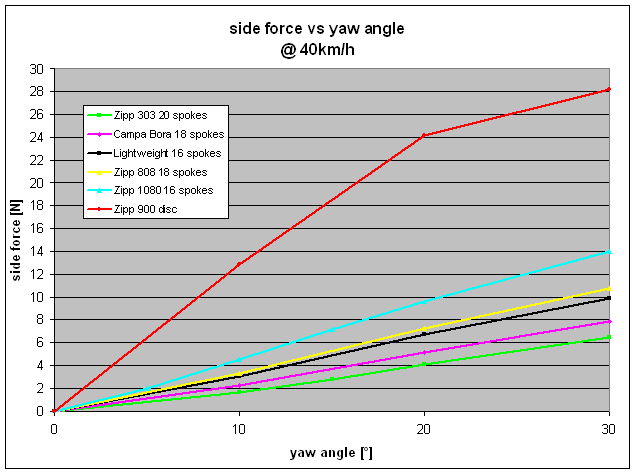
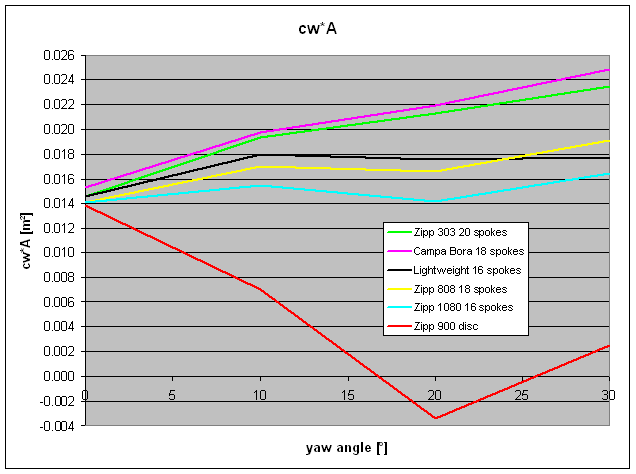
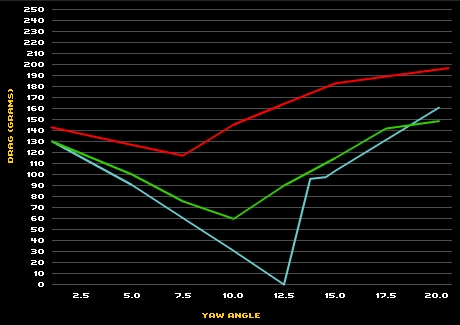
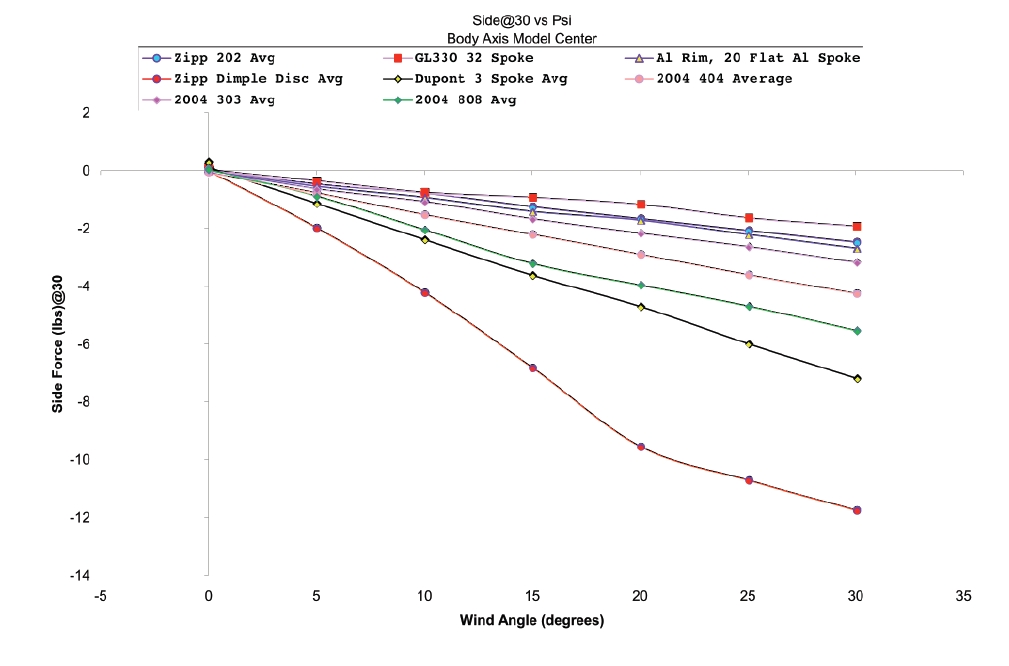
Aerodynamic drag and side forces were determined using FIRE v2008.1 and the characteristic curves compared with results from wind tunnel tests from the leading wheel manufacturers.
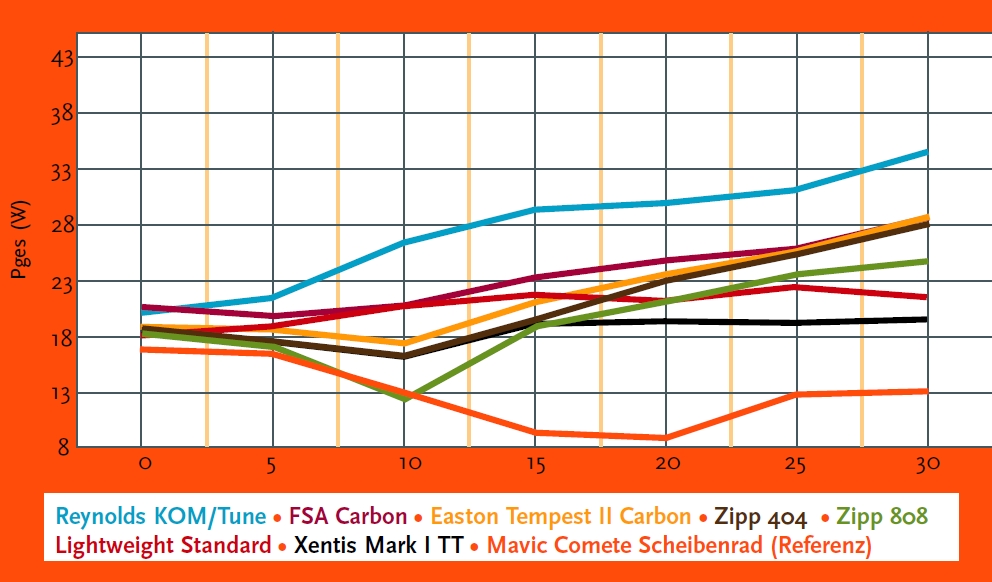
The time differences for the wheel sets for a given power output of a rider were calculated analytically, taking into account the before mentioned drag forces.
[top]3 MAIN SECTION
3.1 APPARENT WIND ANGLE
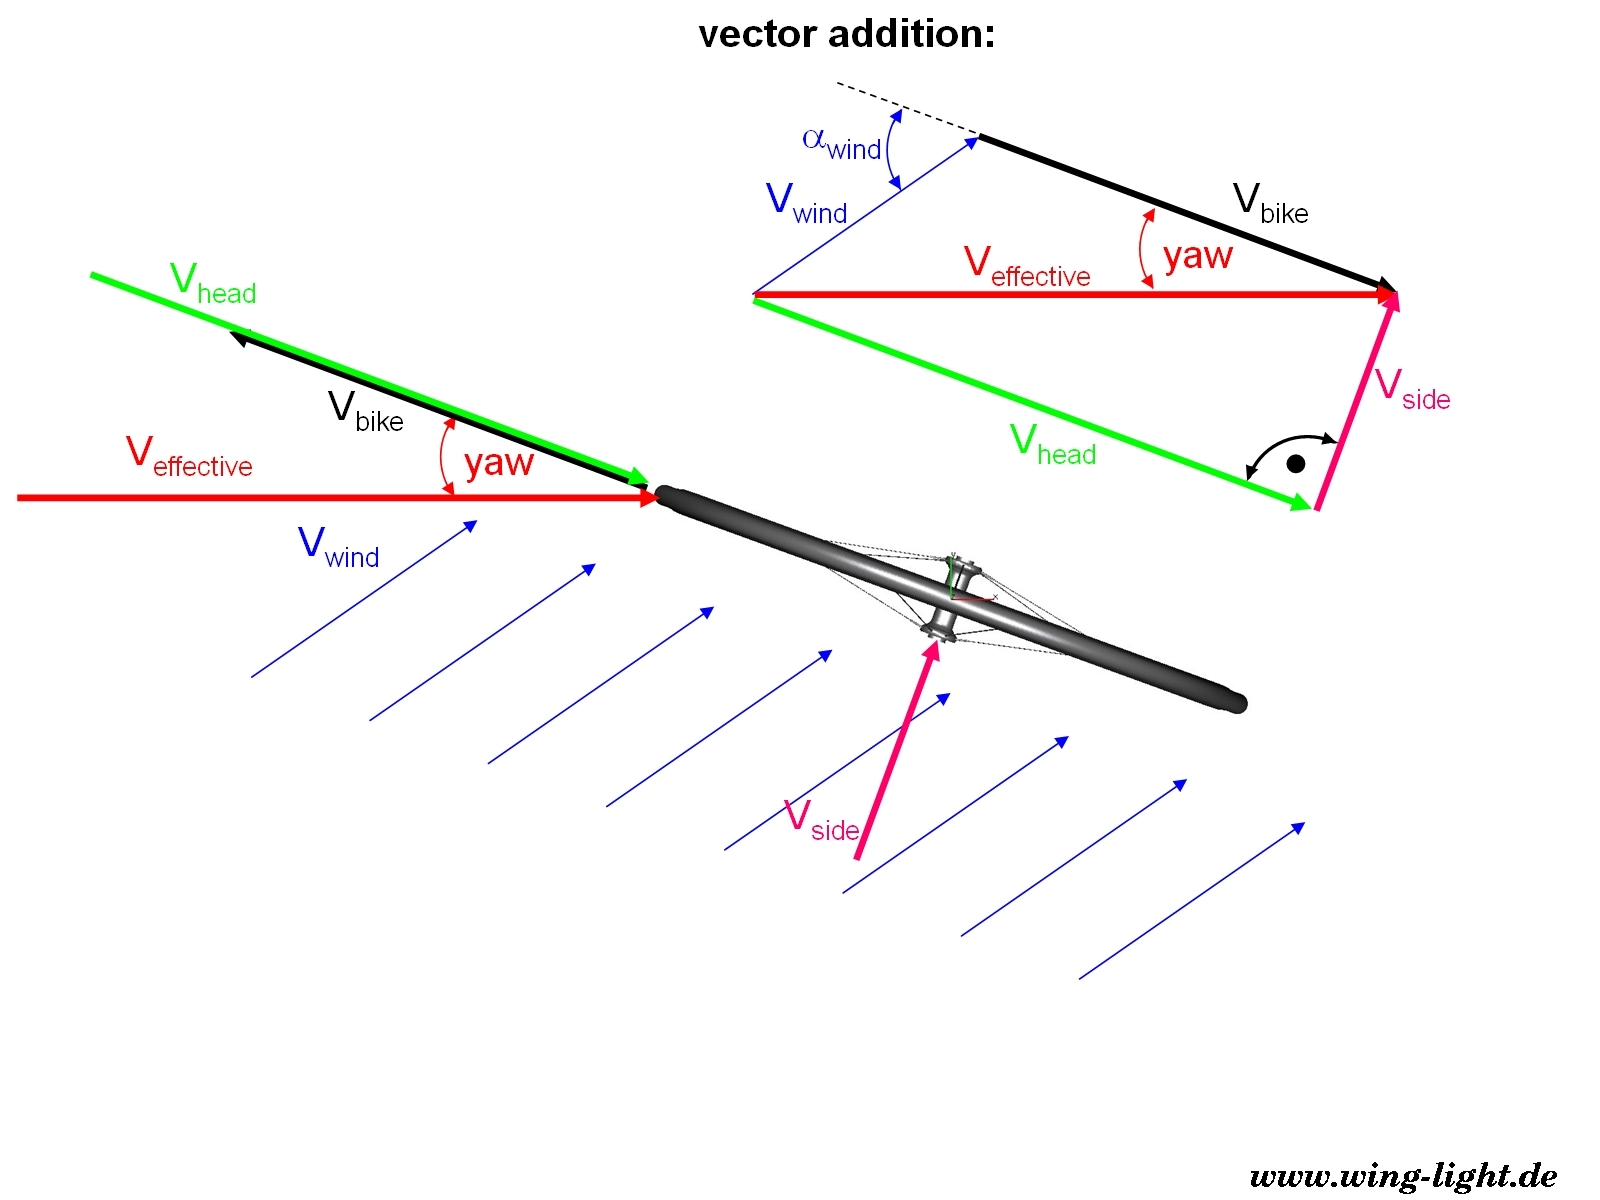
Figure 1: relationship between wind angle, wind speed and bicycle speed
The effective flow velocity and yaw angle can simply be determined by vector addition of the bike speed vector and
the wind speed vector (Figure 1).
This means, the higher the bicycle speed and the lower the wind angle, the lower the yaw angle.
Average wind speeds are rarely above 20 km/h in our areas. Professional time trial (TT) riders achieve average speeds up
to 50 km/h, good hobby and amateur riders up to 45 km/h, and average triathlets between 35 km/h and 40 km/h.
For all possible wind angles with a wind speed up to 20 km/h this means, that professional cyclists rarely experience
yaw angles above 20°.
Even amateur or hobby cyclists rarely have to fight against upstream flow angles between 20° and 25°.
Only cyclists with an average speed of 35 km/h or less would experience yaw angles approaching 30°.
These simple investigations highlight why the major wheel manufacturers optimize their aerodynamic wheels for yaw angles up to 15°.
(More details about the apparent wind angle can be found in our TechTalk area)
[top]3.2 CFD SIMULATION
3.2.1 SIMULATION MODEL
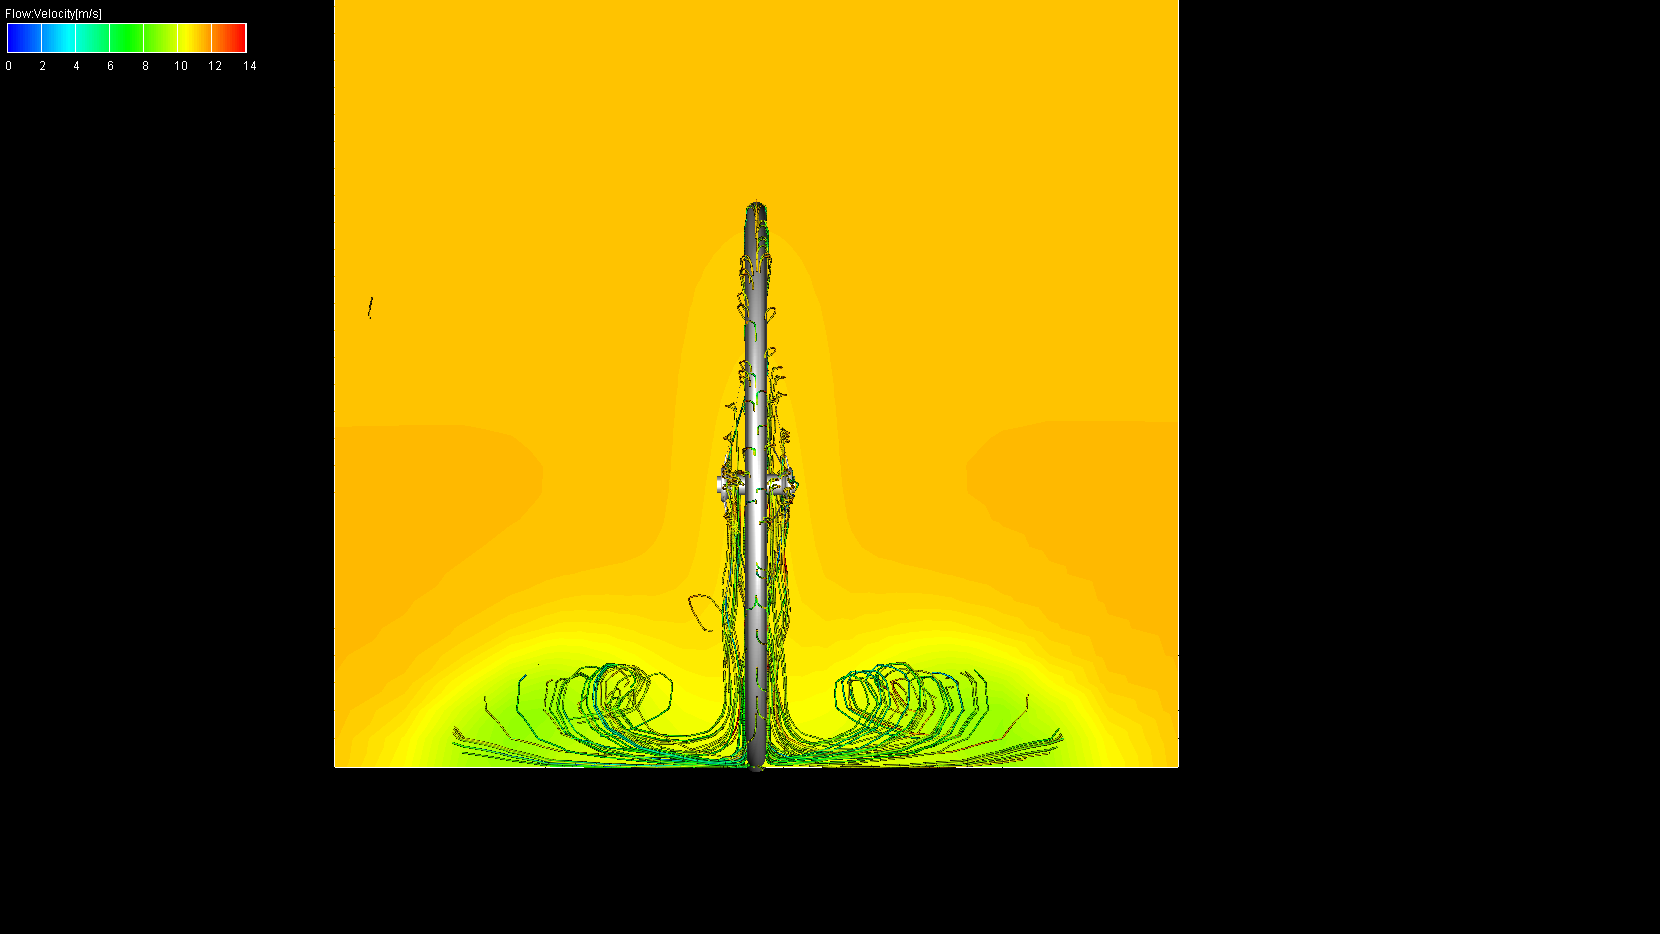
All CFD simulations were performed with FIRE v2008.1 in steady state mode using the k-e-turbulence model.
The virtual wind tunnel consists of a moving road, inlet boundary with 11.11 m/s (40 km/h) inlet velocity and 1 bar
outlet pressure boundary. The three remaining sides are defined as symmetry. Figure 2 shows the simulation domain with
its dimensions.
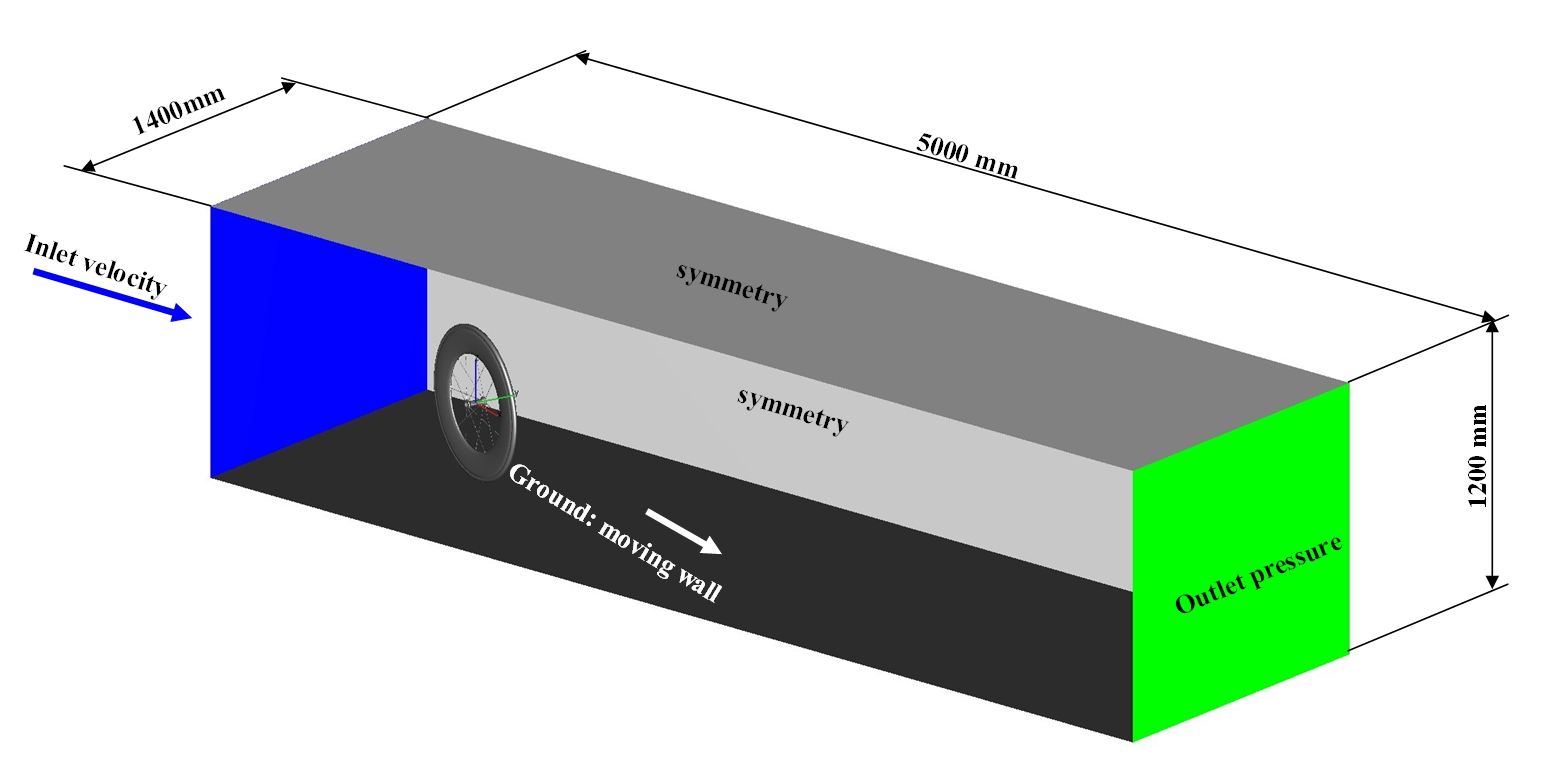
Figure 2: CFD simulation domain with dimensions
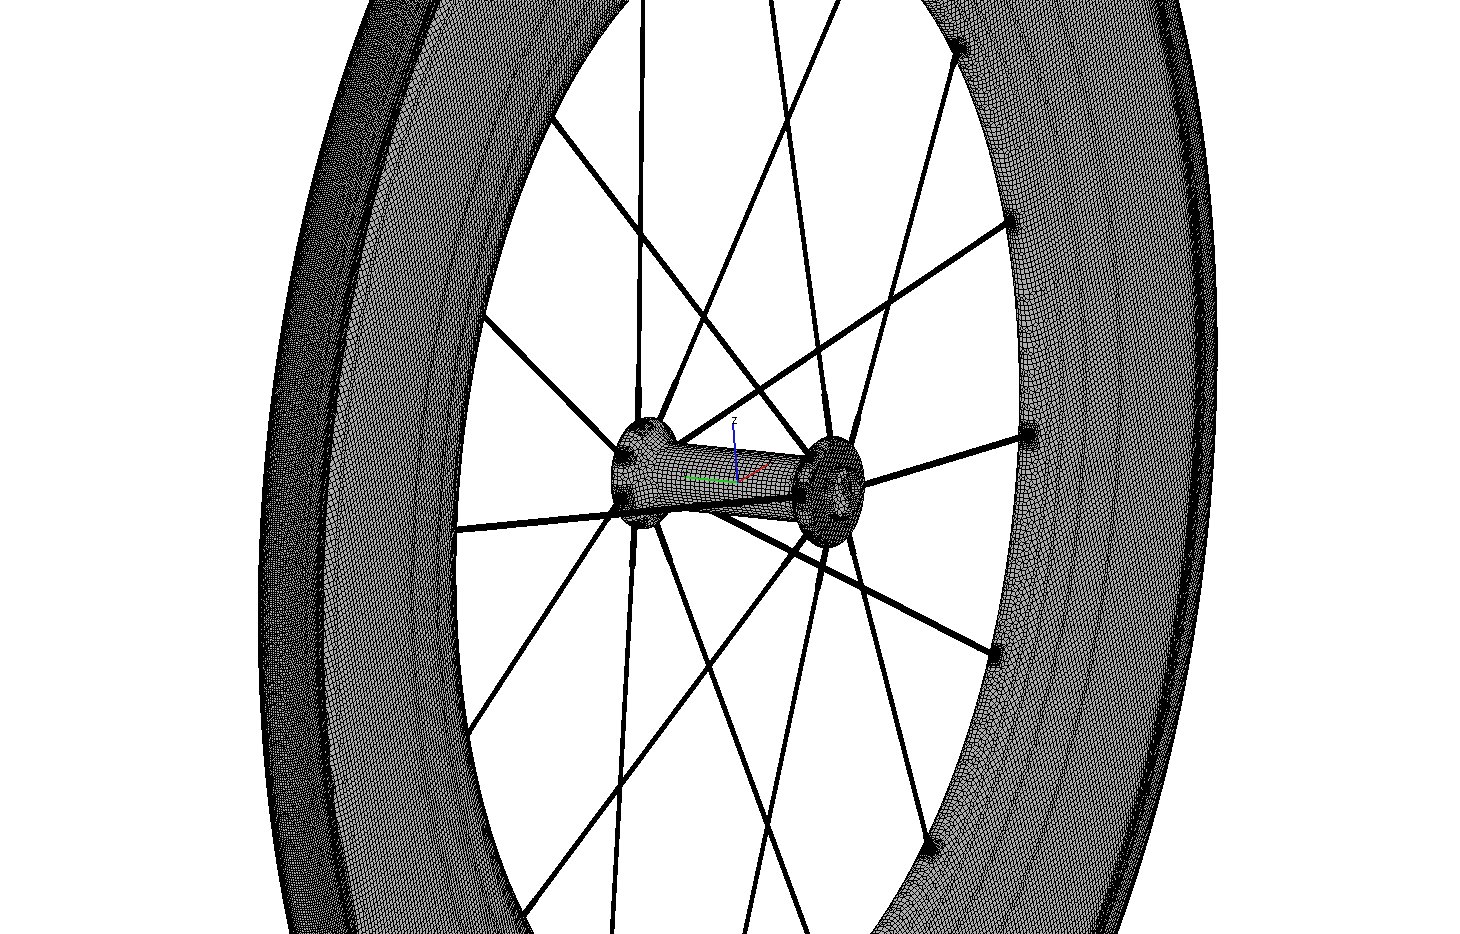
The rotating wheel is modeled with the MRF (multiple reference frame) method. Therefore the entire wheel is covered
inside the MRF volume with the arbitrary interface between MRF volume and the wind tunnel domain (see Figure 3).
For all simulations the wheels rotate around the y-axis with the respective rotational speed of 316.73 rpm. The yaw angle
was varied by turning the wind tunnel around the z-axis through the respective angle.
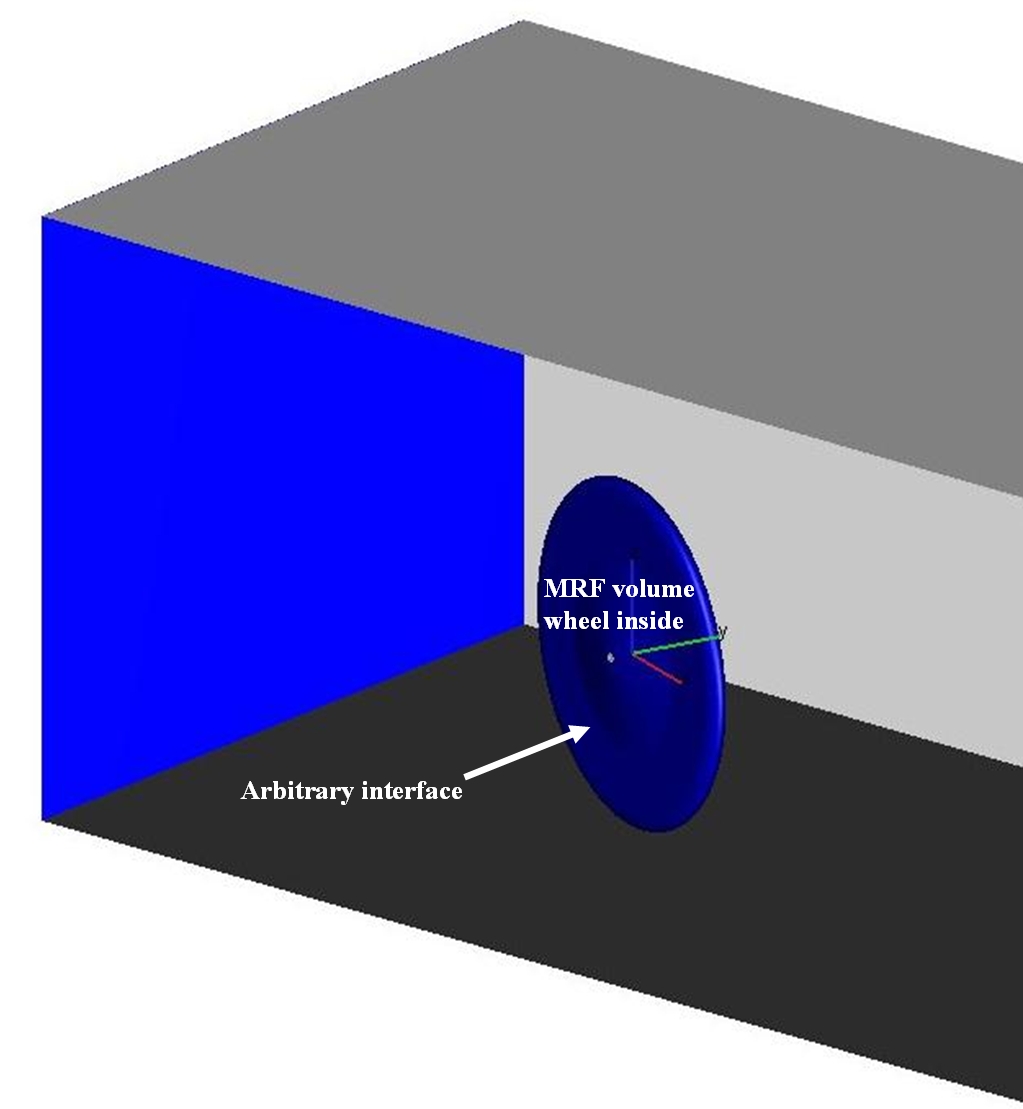
Figure 3: definition of MRF volume
[top]
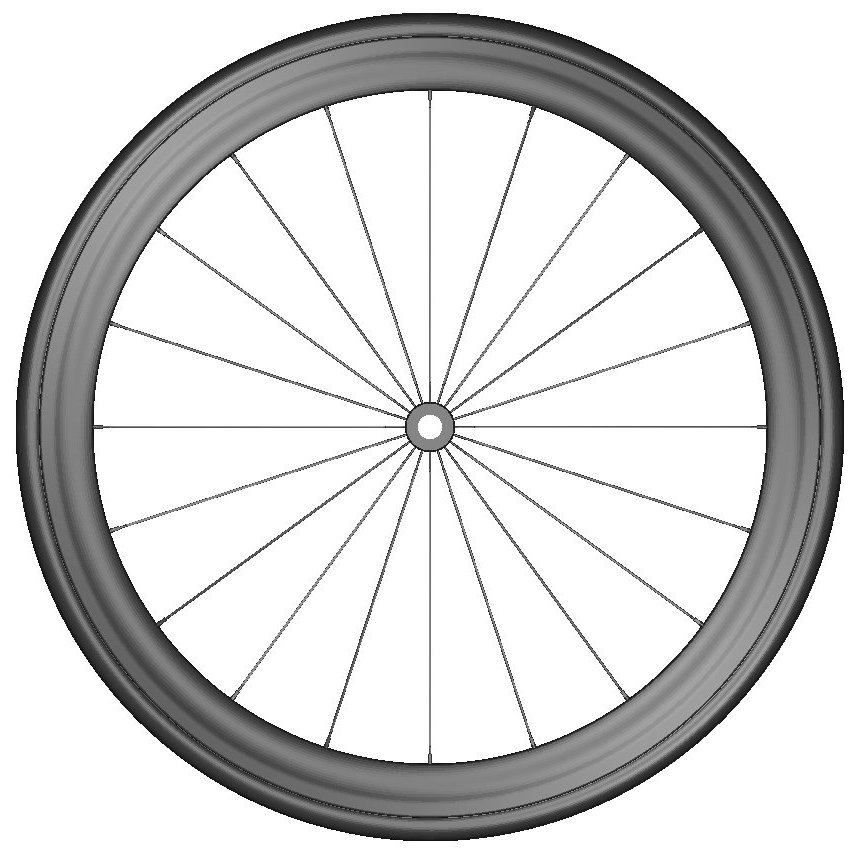
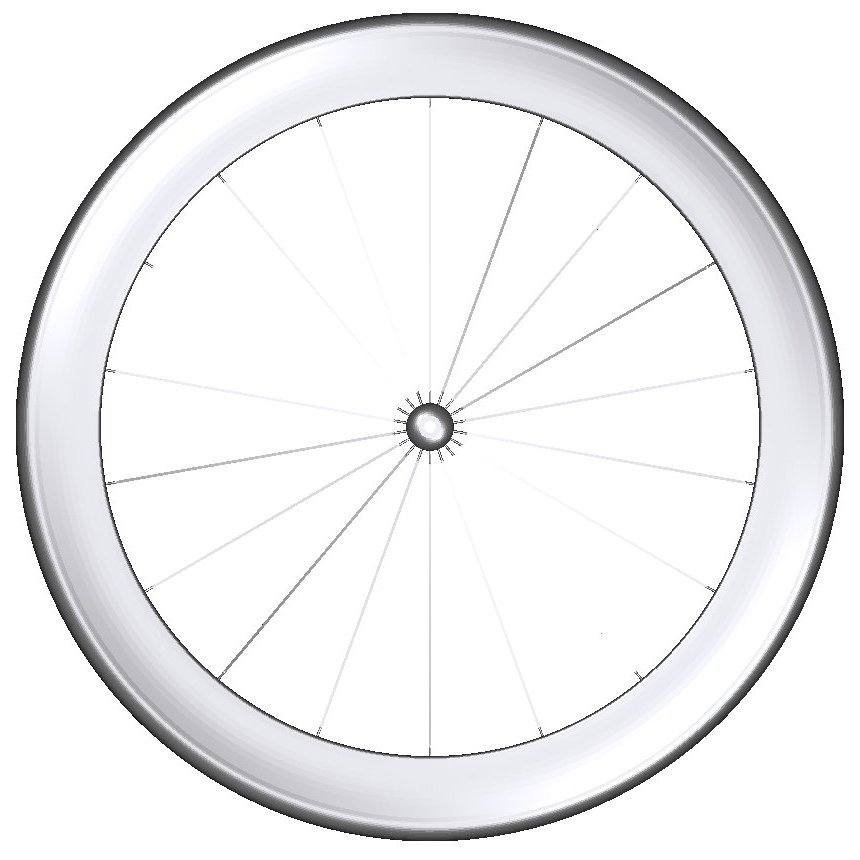
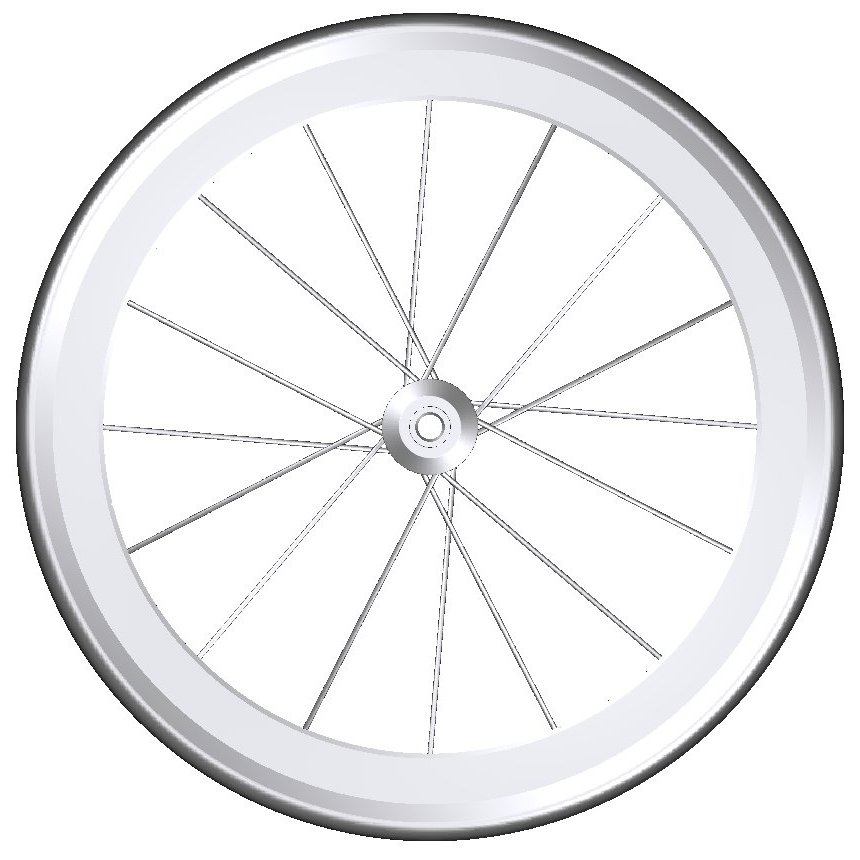
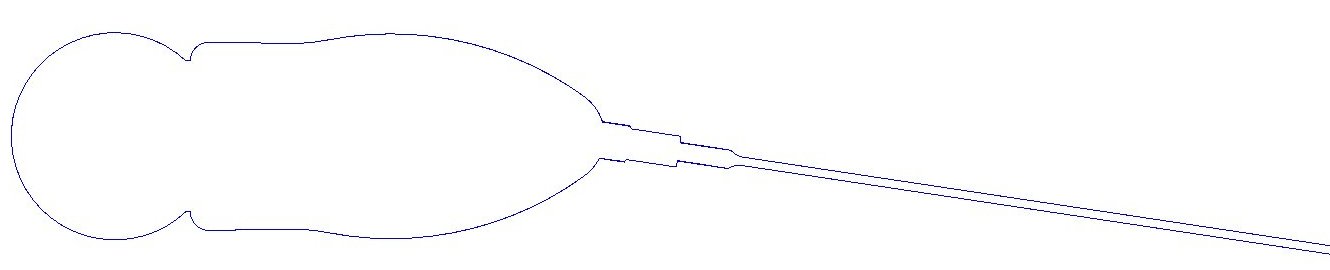
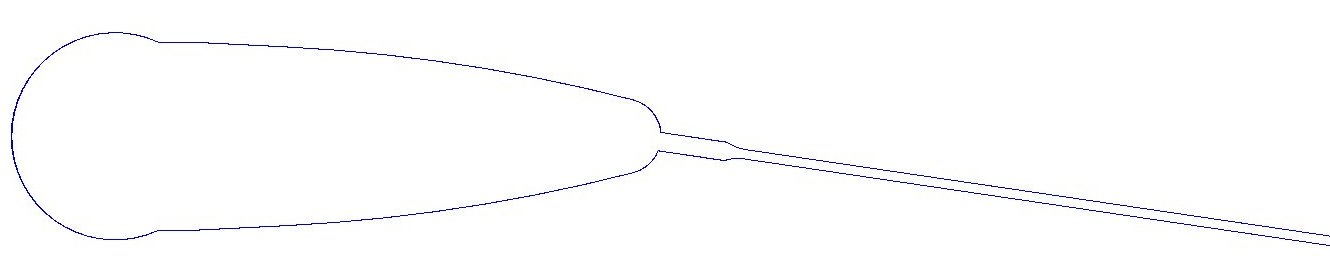
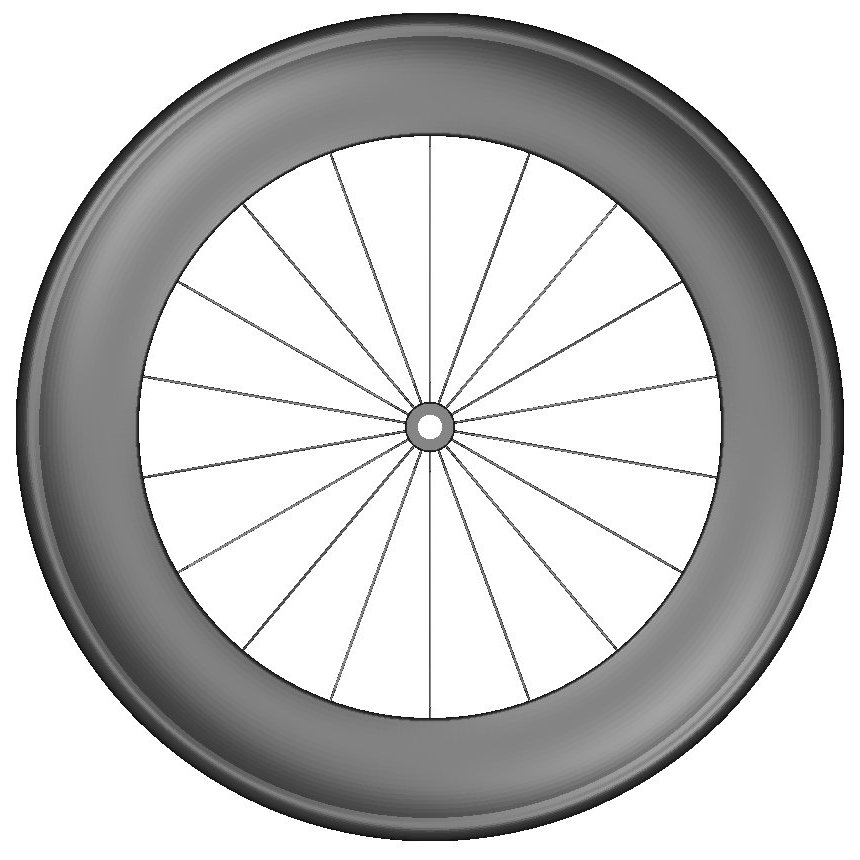
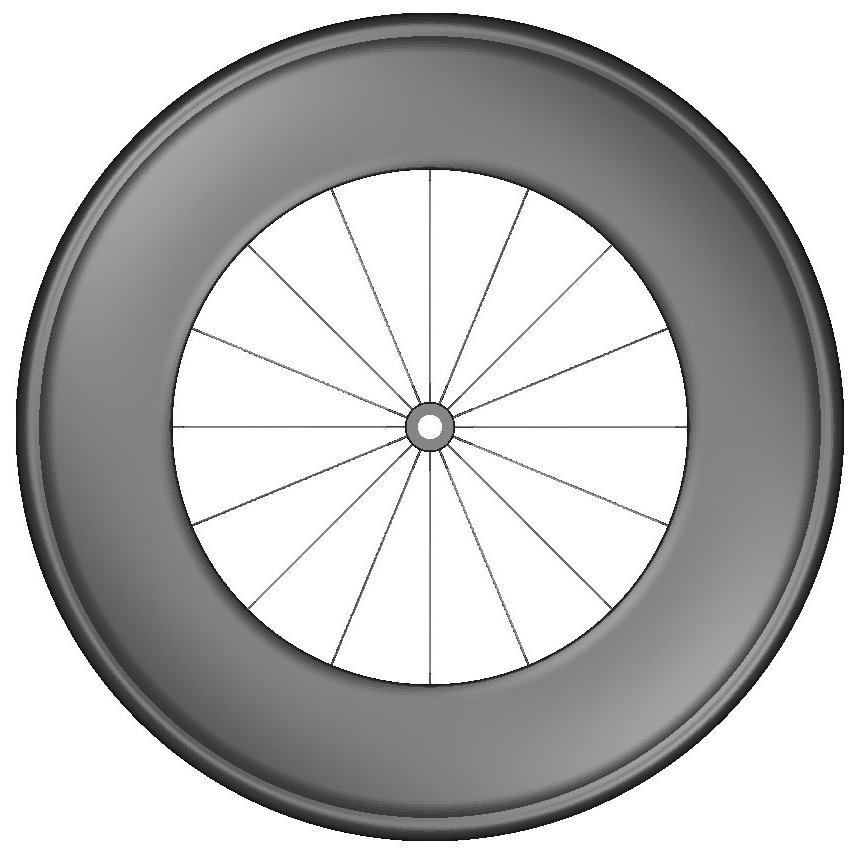
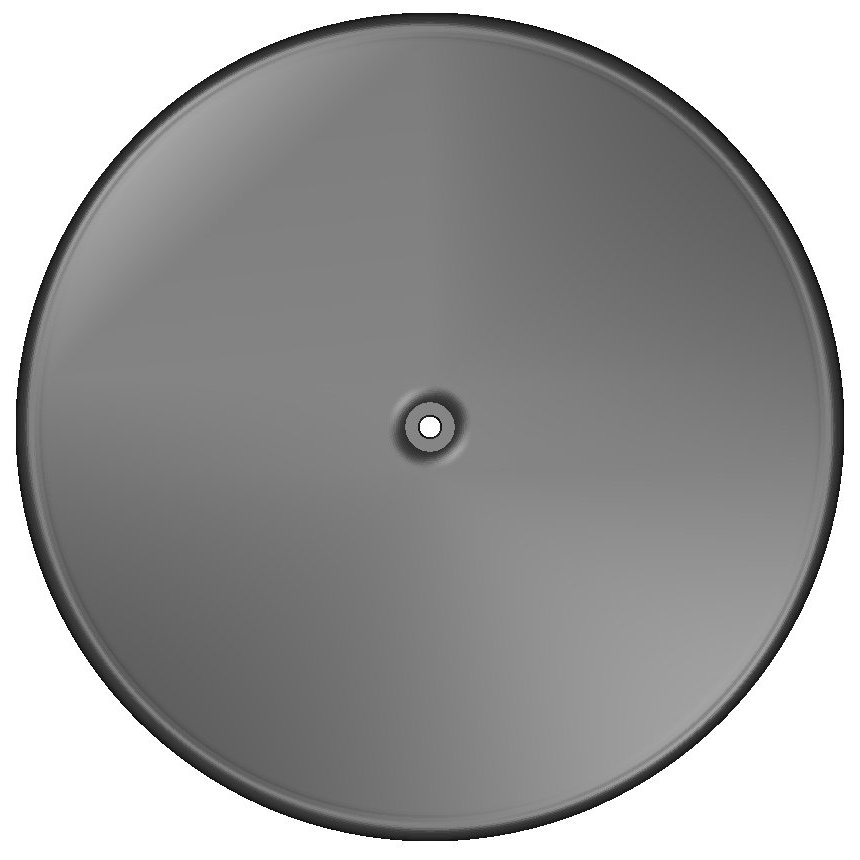
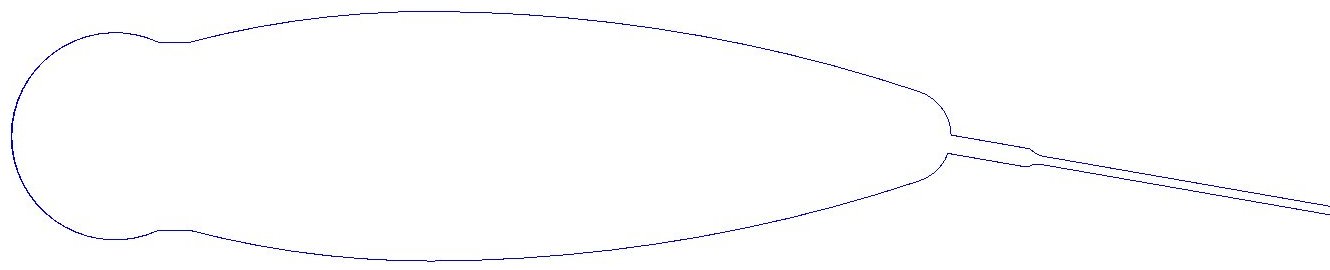
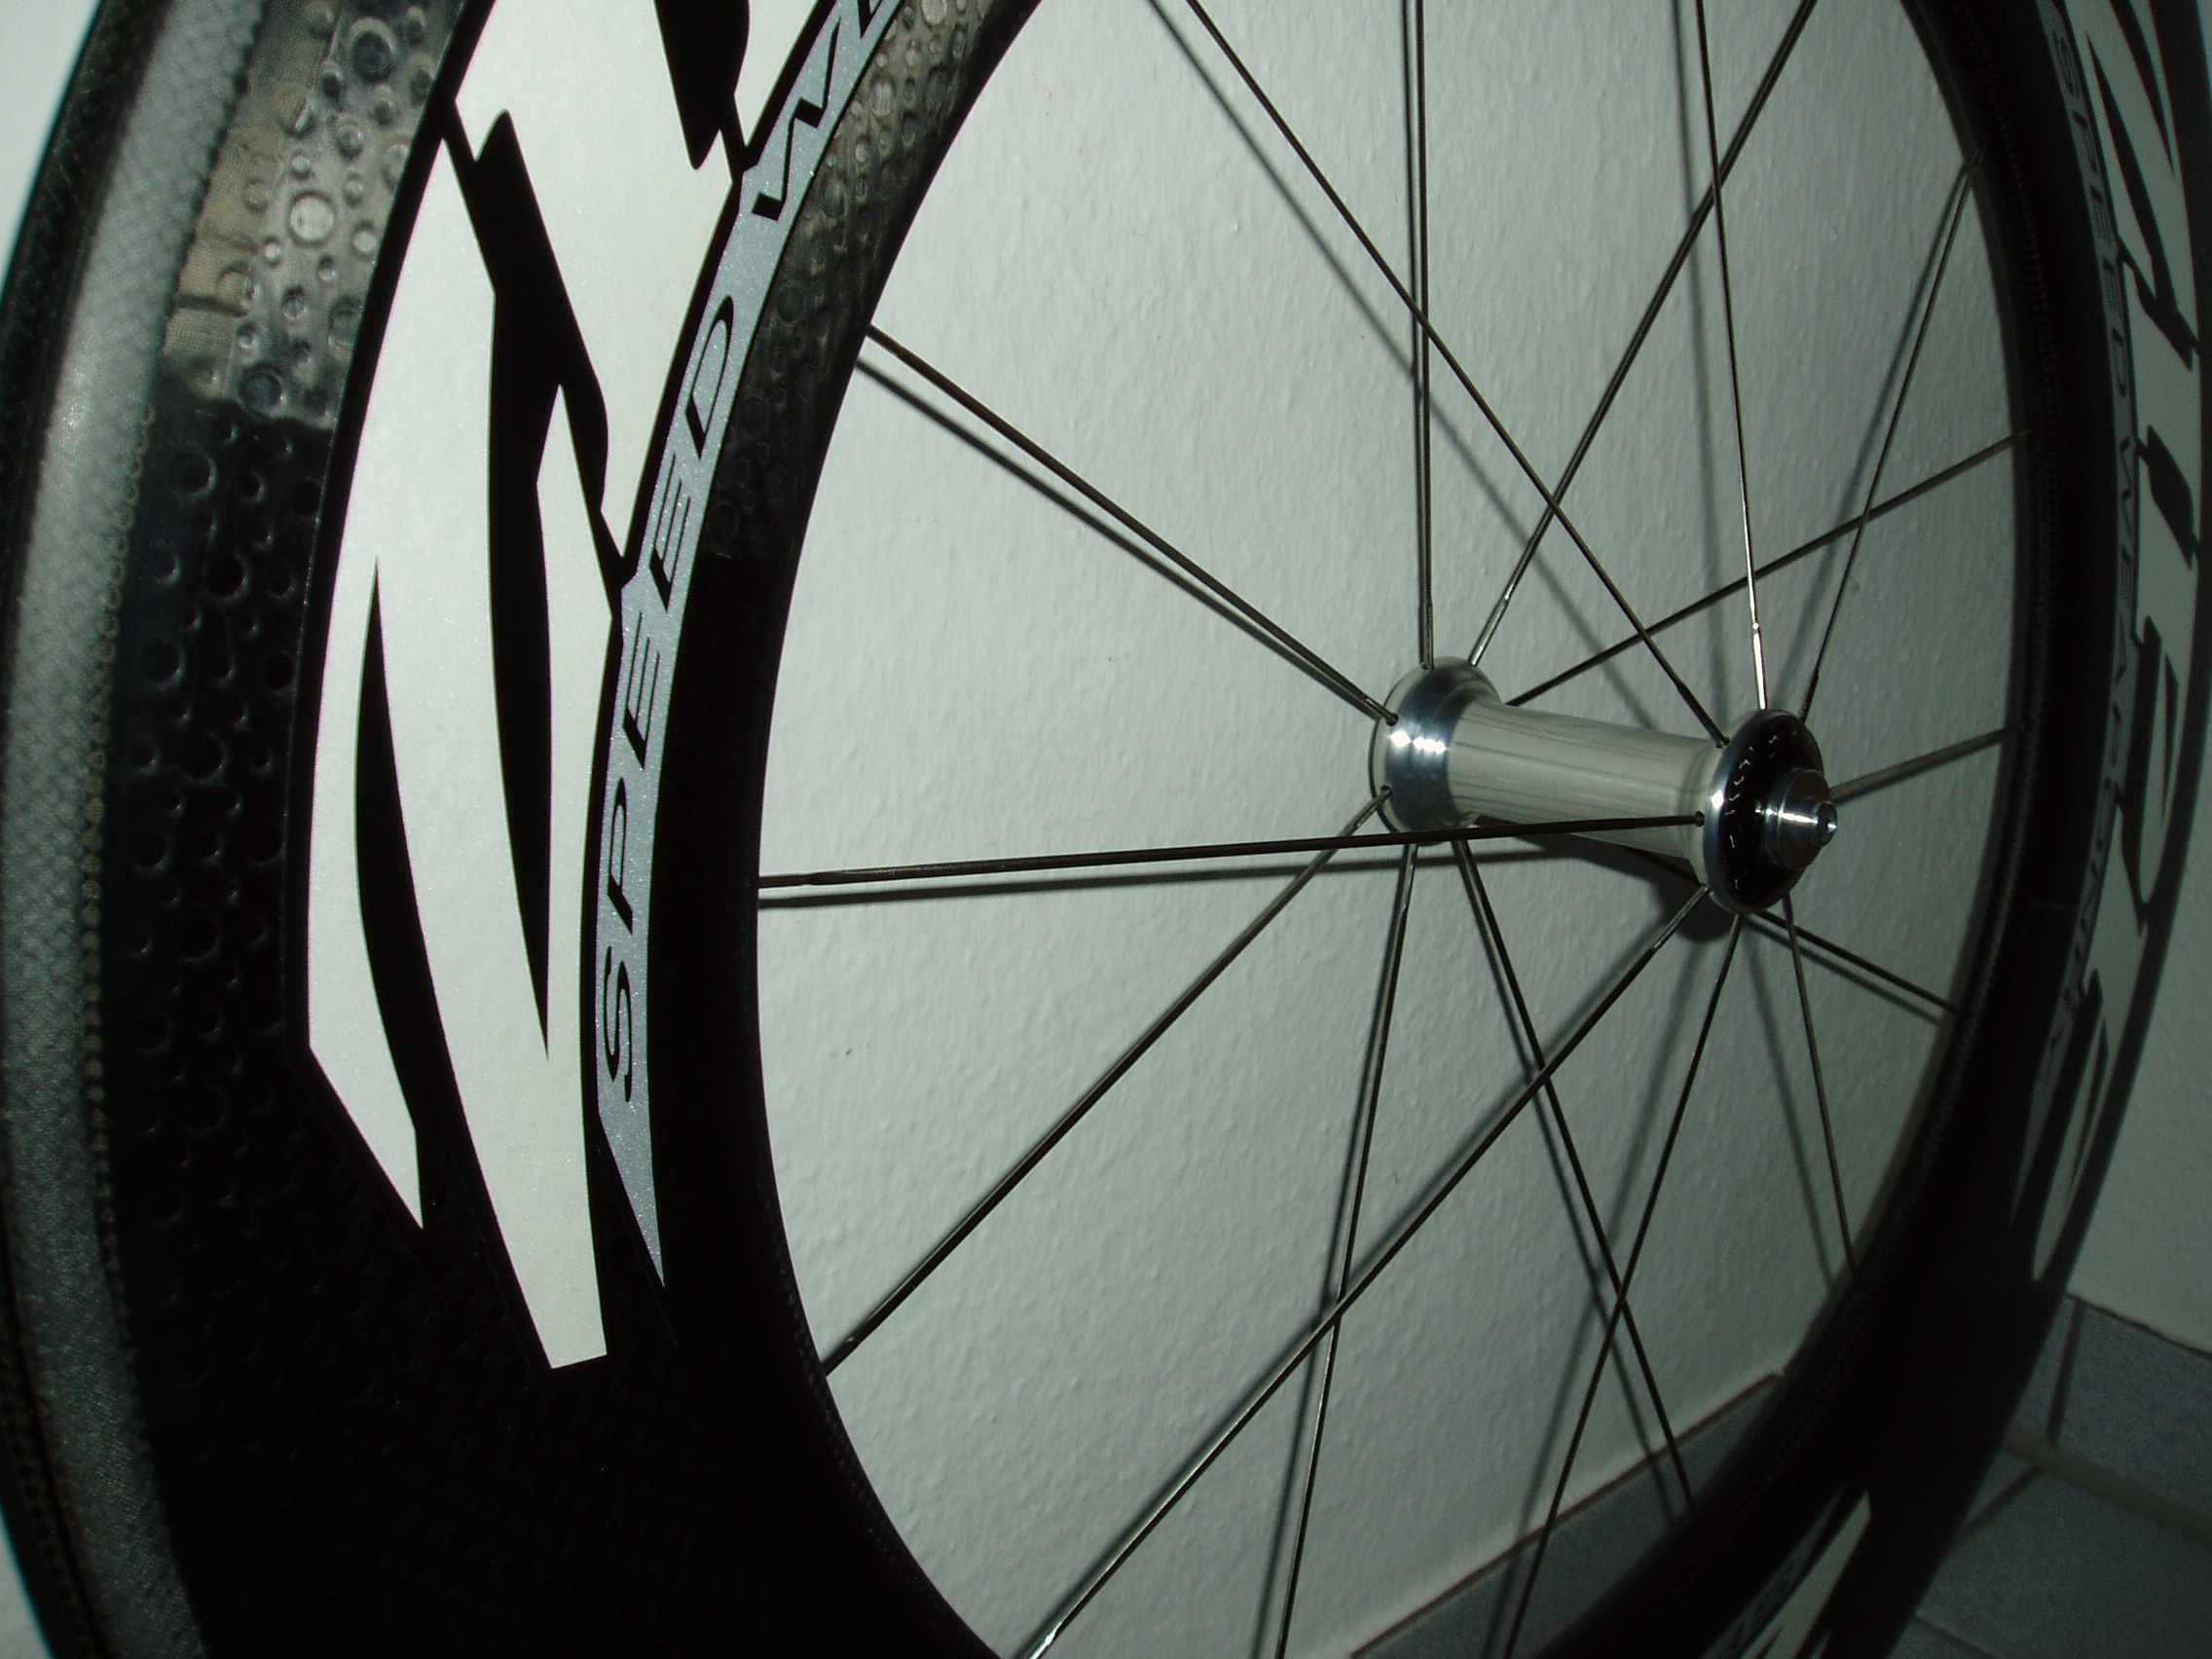
3.2.2 WHEEL GEOMETRIES
6 wheel geometries were investigated, which differ in rim depth, rim profile and spoke count. All investigated wheels
are thought to be aerodynamic wheels with rims built of carbon and considerably deeper than traditional aluminium rims.
The models were meshed with Fame Hybrid. The overall simulation mesh consists of 1Mio (disc) to 6Mio (Zipp 303) cells.